Dubai property prices 2026: ready apartments are selling for about 7% less per square foot than at the start of the year, and off-plan prices have barely moved, by Dubai Land Department (DLD) sales records. Ready apartments registered from July to October 2026 sold for a median AED 1,368 per sq ft, against AED 1,466 from 1 January to 27 February: 6.7% lower, and the same −6.7% when each of 237 buildings is compared only with itself. Within the same off-plan projects, the median change was −0.9% across 387 projects.
The number of sales fell harder than prices: DLD registered 9,687 apartment and villa sales in October 2026, a third fewer than the 14,535 of January. We split the year at 28 February 2026, the day the regional conflict began: that evening the UAE Ministry of Defence said its air defences had intercepted Iranian missiles and drones (WAM, via Sharjah 24, 28 February 2026).
Last checked: 16 November 2026, with DLD's open-data export of sales registered from 1 January to 3 November 2026. Every figure is a median of registered prices, not a price index, shown with the number of sales behind it. We update this page when we have the November figures.
Dubai property prices 2026: how much have they changed?
Ready apartment prices per square foot fell 6.7% between January–February and July–October 2026, from a median AED 1,466 to AED 1,368. The median price paid barely changed, at AED 1,150,000 against AED 1,160,000, because later flats were a little larger. Off-plan medians fell 5.9% per square foot citywide but barely moved within the same projects; ready villas fell 3.3%.
| Мера | 1 Jan–27 Feb 2026 | 28 Feb–30 Jun 2026 | 1 Jul–31 Oct 2026 | Change, first to last period |
|---|---|---|---|---|
| Ready apartments: sales | 5,944 | 7,431 | 8,677 | |
| Ready apartments: median AED per sq ft | 1,466 | 1,380 | 1,368 | −6.7% |
| Ready apartments: median price (AED) | 1,160,000 | 1,120,000 | 1,150,000 | −0.9% |
| Ready apartments: median size (sq ft) | 836 | 833 | 865 | +3.5% |
| Off-plan apartments: sales | 17,686 | 31,824 | 27,537 | |
| Off-plan apartments: median AED per sq ft | 1,856 | 1,787 | 1,746 | −5.9% |
| Off-plan apartments: median price (AED) | 1,459,343 | 1,283,751 | 1,095,221 | −25.0% |
| Off-plan apartments: median size (sq ft) | 810 | 755 | 689 | −14.9% |
| Ready villas: sales | 615 | 809 | 935 | |
| Ready villas: median AED per sq ft | 1,570 | 1,553 | 1,517 | −3.3% |
| Ready villas: median price (AED) | 3,550,000 | 3,600,000 | 3,500,000 | −1.4% |
A median also moves with the kind of homes sold, which is why the table shows sizes and the sections below compare buildings with themselves. For a wider view, The National reported on 7 October 2026 that S&P Global Ratings, quoting industry reports, put the fall in Dubai prices at 5% to 15% between the end of 2025 and September 2026 (The National). Registered ready apartment sales sit towards the lower end of that range.
Which Dubai communities eased and which held their prices?
Of the 24 communities with enough ready apartment sales to compare, 13 were clearly lower from July to October, among them Downtown Dubai (−9.0%), Jumeirah Village Circle (−8.8%), Dubai Hills Estate (−7.4%) and Business Bay (−7.3%), where the same buildings fell by similar amounts. In the other 11 the change is within sampling noise; none was clearly higher.
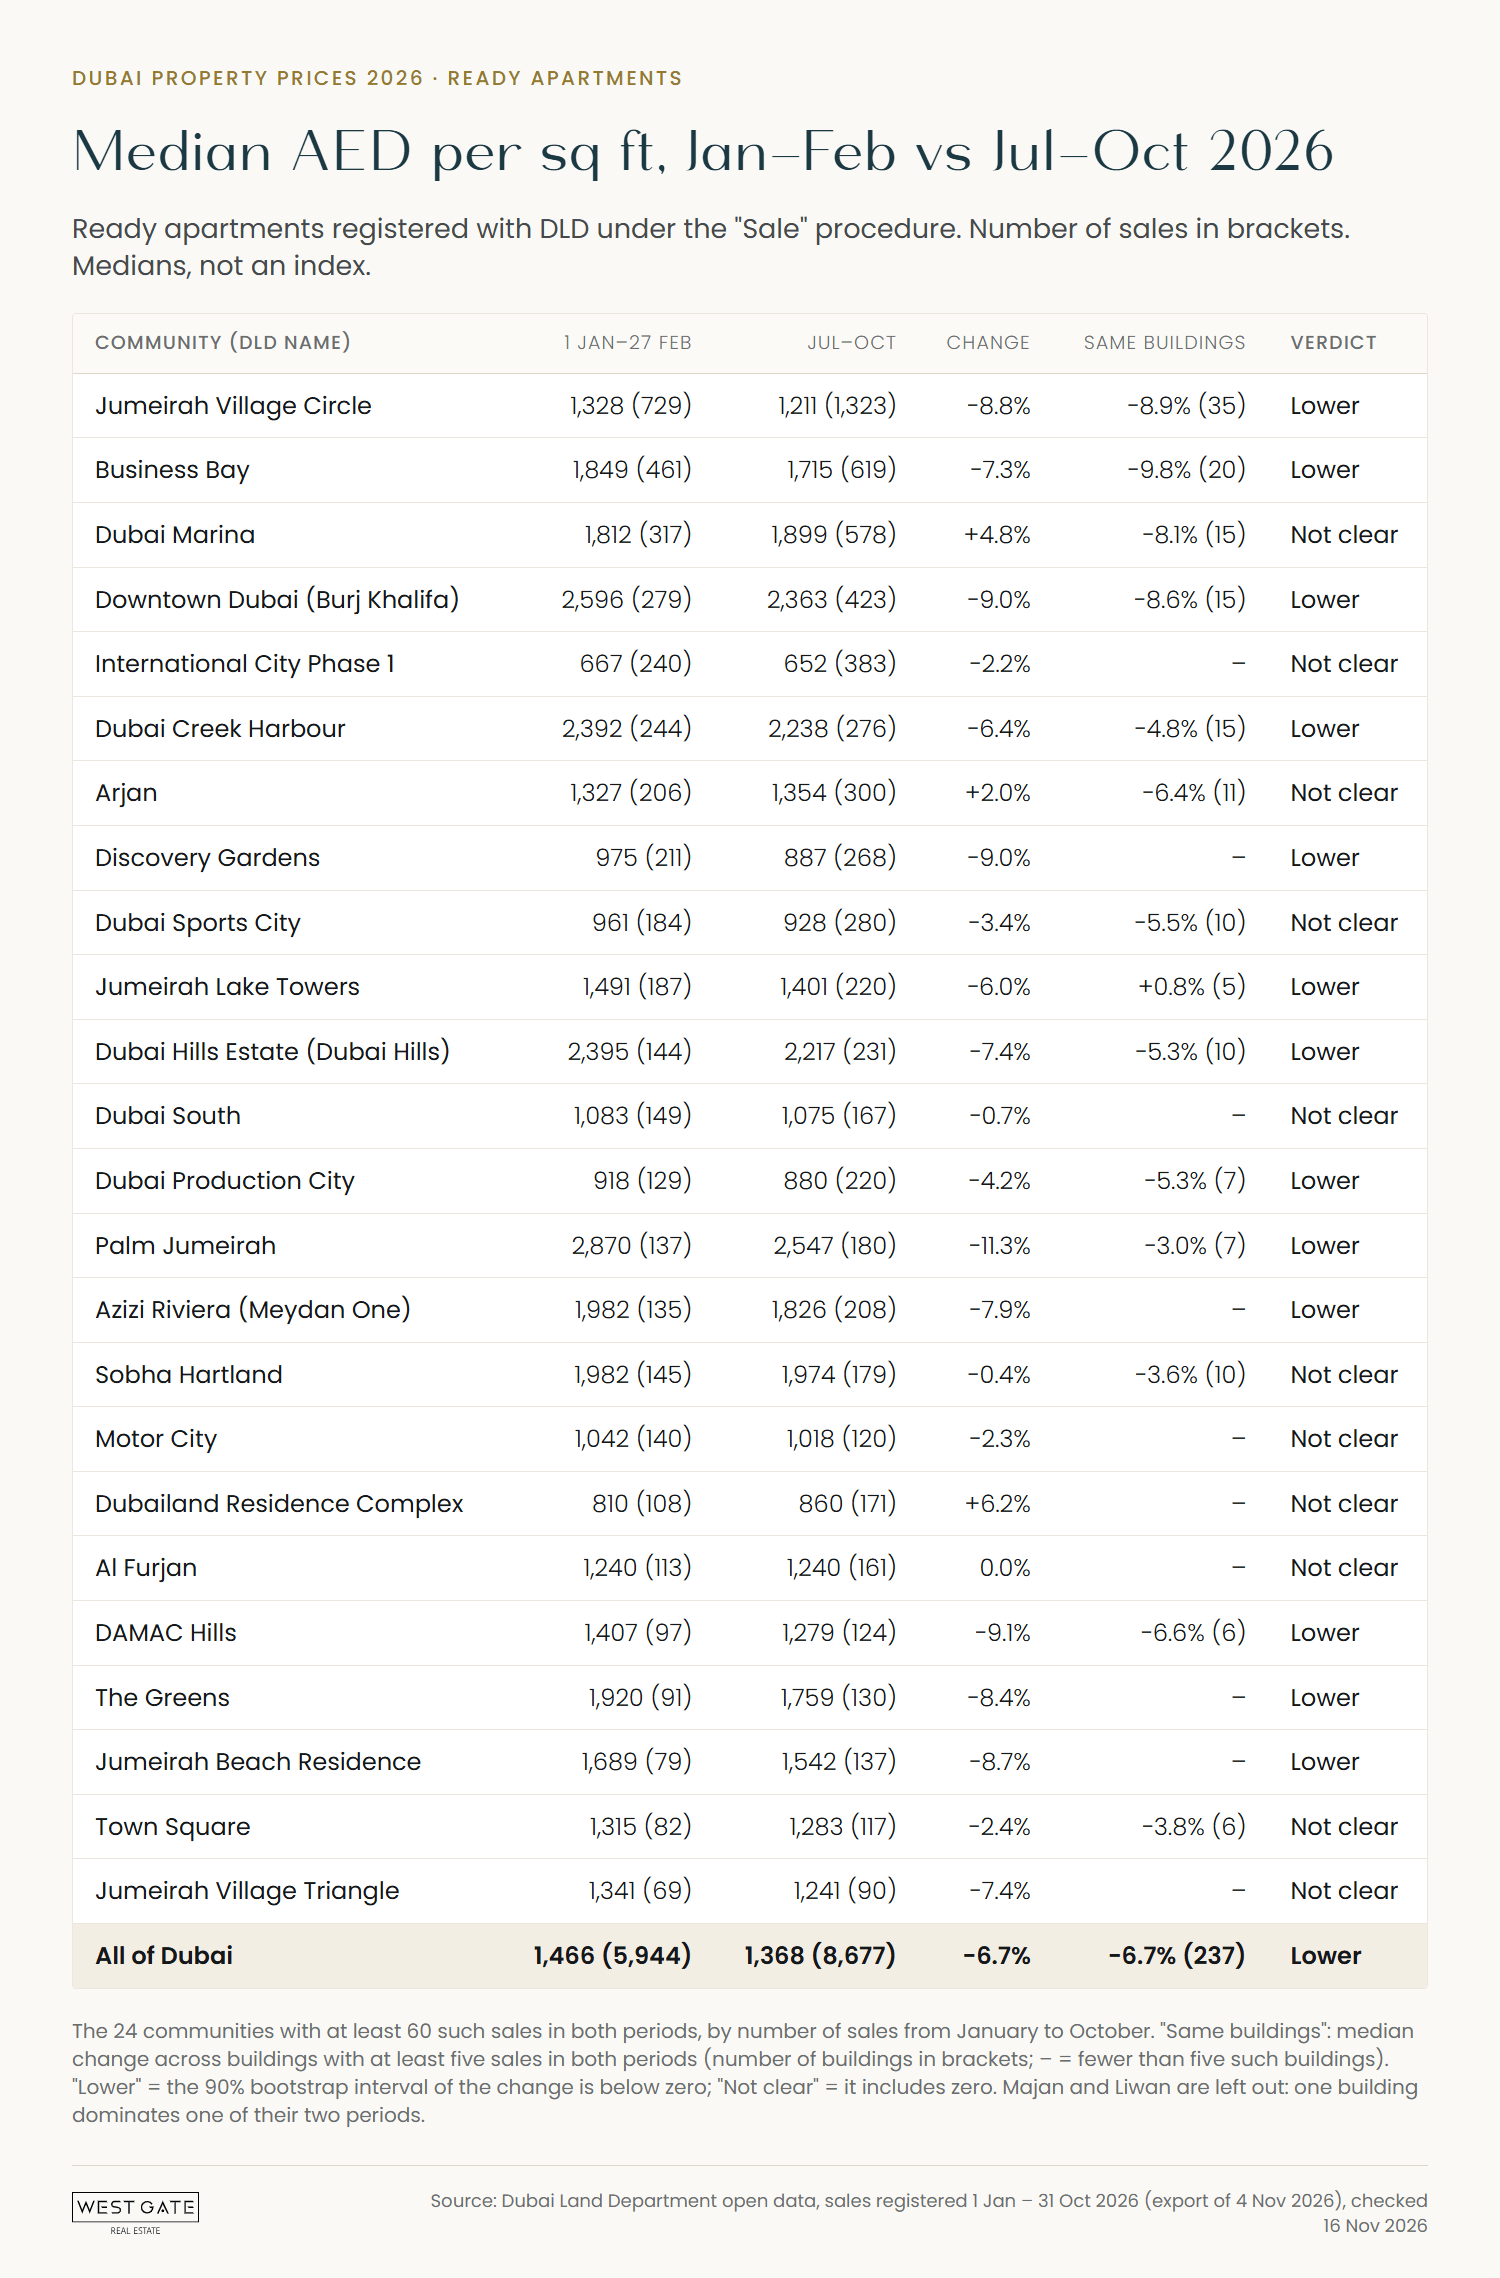
| Community (DLD name) | 1 Jan–27 Feb: median AED/sq ft (sales) | Jul–Oct: median AED/sq ft (sales) | Change | Same buildings only (buildings) | Verdict |
|---|---|---|---|---|---|
| Дубай | 1,328 (729) | 1,211 (1,323) | −8.8% | −8.9% (35) | Низкая |
| Вид на пальму | 1,849 (461) | 1,715 (619) | −7.3% | −9.8% (20) | Низкая |
| Дубай Марина | 1,812 (317) | 1,899 (578) | +4.8% | −8.1% (15) | Not clear |
| Downtown Dubai (Burj Khalifa) | 2,596 (279) | 2,363 (423) | −9.0% | −8.6% (15) | Низкая |
| International City Phase 1 | 667 (240) | 652 (383) | −2.2% | – | Not clear |
| Dubai Creek Harbour | 2,392 (244) | 2,238 (276) | −6.4% | −4.8% (15) | Низкая |
| Арьян | 1,327 (206) | 1,354 (300) | +2.0% | −6.4% (11) | Not clear |
| Сады Дискавери | 975 (211) | 887 (268) | −9.0% | – | Низкая |
| Дубай Спортс Сити | 961 (184) | 928 (280) | −3.4% | −5.5% (10) | Not clear |
| Джумейра-Лейк-Тауэрс | 1,491 (187) | 1,401 (220) | −6.0% | +0.8% (5) | Низкая |
| Dubai Hills Estate (Dubai Hills) | 2,395 (144) | 2,217 (231) | −7.4% | −5.3% (10) | Низкая |
| Дубай Саут (Dubai South) | 1,083 (149) | 1,075 (167) | −0.7% | – | Not clear |
| Дубайский производственный город | 918 (129) | 880 (220) | −4.2% | −5.3% (7) | Низкая |
| Пальма Джумейра | 2,870 (137) | 2,547 (180) | −11.3% | −3.0% (7) | Низкая |
| Azizi Riviera (Meydan One) | 1,982 (135) | 1,826 (208) | −7.9% | – | Низкая |
| Sobha Hartland (Sobha Heartland) | 1,982 (145) | 1,974 (179) | −0.4% | −3.6% (10) | Not clear |
| Motor City | 1,042 (140) | 1,018 (120) | −2.3% | – | Not clear |
| Жилой комплекс Dubailand | 810 (108) | 860 (171) | +6.2% | – | Not clear |
| Аль-Фурджан | 1,240 (113) | 1,240 (161) | 0.0% | – | Not clear |
| Холмы Дамак | 1,407 (97) | 1,279 (124) | −9.1% | −6.6% (6) | Низкая |
| The Greens | 1,920 (91) | 1,759 (130) | −8.4% | – | Низкая |
| Резиденция Джумейра Бич | 1,689 (79) | 1,542 (137) | −8.7% | – | Низкая |
| Таун Сквер | 1,315 (82) | 1,283 (117) | −2.4% | −3.8% (6) | Not clear |
| Деревенский треугольник Джумейра | 1,341 (69) | 1,241 (90) | −7.4% | – | Not clear |
| All of Dubai | 1,466 (5,944) | 1,368 (8,677) | −6.7% | −6.7% (237) | Низкая |
How to read it. "Same buildings only" compares each building with itself, so a new tower or a run of studios in one period doesn't move it; it is shown where at least five buildings had five or more sales in both periods. "Verdict" comes from resampling each community's sales 1,000 times: "Lower" means the middle 90% of the resampled changes are all below zero.
Where the two measures disagree. Dubai Marina's median rose 4.8%, but its 15 matched buildings were 8.1% lower: more of the later sales were in pricier towers. Arjan is the same (+2.0% against −6.4%). Palm Jumeirah runs the other way: −11.3% at the median, −3.0% within seven buildings. In Jumeirah Lake Towers (JLT) the median fell 6.0% while five matched buildings were level.
Where prices held. International City Phase 1, Dubai South, Al Furjan, Sobha Hartland, Motor City and Town Square show no clear change; five of these six sold below AED 1,300 per sq ft from July to October. Majan and Liwan are left out: one building dominates one of their periods (133 of Majan's 194 January–February sales, 160 of Liwan's 257 July–October sales), so their medians compare different buildings, not different times.
Did Dubai property prices keep falling after the summer?
No further fall shows after July. Measured sale by sale against the same building's January–February median, ready apartment prices were level in March, 2.1% lower in April and 5.7% lower in June. The gap reached 7.3% in July, then narrowed slightly to 7.0%, 5.7% and 5.5% in August, September and October.
| Month registered (2026) | Ready sales compared | Against the same building's Jan–Feb median |
|---|---|---|
| March | 839 | +0.8% |
| April | 857 | −2.1% |
| May | 630 | −4.7% |
| June | 791 | −5.7% |
| July | 890 | −7.3% |
| August | 788 | −7.0% |
| September | 806 | −5.7% |
| October | 868 | −5.5% |
March looks level partly because a ready sale is registered at transfer, after the price is agreed; Cavendish Maxwell, quoted by The National, points to the same lag. Each month rests on 630 to 890 sales, so read a move of a point or two with care.
Are expensive homes falling more than cheaper ones?
Yes. In 2026 the pricier the building, the more its prices eased. Buildings that sold below AED 1,000 per sq ft in January and February were level by July–October (+0.5% across 29 buildings), while buildings above AED 3,000 per sq ft were 13.2% lower, with 19 of those 22 buildings down by more than 2%.
| Building's Jan–Feb median (AED per sq ft) | Buildings | Median change by Jul–Oct | Buildings more than 2% lower |
|---|---|---|---|
| Under 1,000 | 29 | +0.5% | 12 |
| 1,000–1,499 | 66 | −5.8% | 50 |
| 1,500–1,999 | 55 | −8.6% | 41 |
| 2,000–2,999 | 65 | −7.4% | 54 |
| 3,000 and above | 22 | −13.2% | 19 |
| All matched buildings | 237 | −6.7% | 176 |
By size the pattern repeats: ready studios held at a median AED 1,300 per sq ft citywide (within the same buildings they were cheaper, so the steady median reflects which buildings sold), while two-bedroom flats fell 7.9% and three-bedroom flats 15.7%. Each size's share of sales barely changed, so this is not a change in the mix of sizes.
What happened to off-plan prices in 2026?
Within the same projects, off-plan prices held: the median project's registered price per square foot changed by −0.9% between January–February and July–October 2026, across 387 projects. The citywide median off-plan price fell 25%, to AED 1,095,221, because buyers bought smaller units: studios rose from 25% to 41% of off-plan apartment sales.
The citywide median per square foot fell 5.9% because more sales were in lower-priced projects. Dubai South's residential district (DLD: Madinat Al Mataar, mostly Azizi Venice) went from 1,317 off-plan sales in January–February to 5,128 in July–October, at a median AED 1,723 per sq ft, below the citywide January–February AED 1,856; its own projects were level (+0.5%).
Of the 387 projects, 167 registered more than 2% lower, 104 within 2% and 116 more than 2% higher. Off-plan prices come with a payment plan, and a level price can come with easier terms, which these records don't show. Before you commit, check the building's progress with our guide to off-plan project status in Dubai.
Have villa prices in Dubai fallen in 2026?
Less than flats, at the citywide median: ready villas (DLD's villa category includes townhouses) sold for AED 1,517 per sq ft from July to October against AED 1,570 in January–February, 3.3% lower, on 615 and 935 sales. Only The Springs (DLD: Emirate Living) has 60 or more sales in both periods: 7.5% lower, and 8.3% lower within the same five projects.
How many homes are selling in Dubai now?
Fewer than in January, but ready flats have picked up. DLD registered 14,535 apartment and villa sales in January 2026 and 9,687 in October. The first full week after 28 February had 2,116, against 3,097 to 3,816 a week before it. October's 2,488 ready apartment sales were the most since February, while off-plan apartment registrations were 37% below January. For sale values month by month, see our Dubai property market update for October 2026.
What do 2026 prices mean if you are buying or selling now?
Price a home from its building's recent registered sales, not from the start of the year. In buildings that sold above AED 1,000 per sq ft in January and February, July–October sales registered a median 5.8% to 13.2% lower, depending on the price band, and buyers can see the same records. Below AED 1,000, prices held.
| If you are | What the 2026 registrations show | What to check before agreeing a price |
|---|---|---|
| Buying a ready flat above AED 1,000 per sq ft | Same-building prices 5.8% to 13.2% lower, by price band | The building's registered sales since July for similar sizes, against the asking price |
| Buying a ready flat below AED 1,000 per sq ft | Level: +0.5% across 29 buildings | Condition, service charges and the rent it can earn; a discount is not a given |
| Buying off-plan | Same-project prices level: −0.9% across 387 projects | Price per sq ft against the project's earlier sales, the payment plan and the construction status |
| Selling a ready flat | −6.7% citywide; more than 2% lower in 176 of 237 matched buildings | Your building's July–October registrations, not January's, and a valuation |
| Selling above AED 3,000 per sq ft | −13.2% across 22 buildings | Expect offers that cite those registrations |
These are records of what sold, not a forecast. If you are weighing whether to buy at all, see our rent vs buy guide, EIBOR and Dubai mortgages in 2026 and VAT on property in Dubai. Owners can start from our home valuation page.
Как мы это рассчитали
- Data: DLD's open-data transactions export (Real Estate Data, exported 4 November 2026), "Sales" group, registered 1 January to 31 October 2026 (the three November days are left out).
- Which sales: ready apartments are flats registered under the "Sale" procedure (22,052 after cleaning); off-plan apartments are "Sell – Pre registration" (77,047); ready villas are villas under "Sale" (2,359). Other procedures, such as "Delayed Sell", are left out. The export doesn't say whether a sale is a first sale or a resale.
- Cleaning: transactions on more than one row, sales under AED 100,000 and prices outside AED 150–25,000 per sq ft are dropped; square metres × 10.7639 = square feet.
- Medians, not an index: every figure carries its number of sales, a community needs 60 sales in each period, and buildings are matched by DLD's project name (16,485 of the 22,052 ready sales name one).
- Names: DLD uses land-registry areas: "Burj Khalifa" is Downtown Dubai, "Dubai Hills" is Dubai Hills Estate, "Meydan One" is mostly Azizi Riviera, and "Emirate Living" in the villa figures is The Springs.
Часто задаваемые вопросы
Are Dubai property prices falling in 2026?
Ready apartments sold for a median AED 1,368 per sq ft from July to October 2026, 6.7% below January–February, by Dubai Land Department records, and the gap stopped widening after July. Off-plan prices within the same projects were about level.
How much have Dubai property prices dropped since February 2026?
For ready apartments, 6.7% at the median, citywide and within the same 237 buildings, comparing 1 January–27 February with July–October 2026. Buildings above AED 3,000 per sq ft fell 13.2%; buildings below AED 1,000 were level.
Which areas of Dubai held their property prices in 2026?
International City Phase 1, Dubai South, Al Furjan, Sobha Hartland, Motor City and Town Square showed no clear change in ready apartment prices between January–February and July–October 2026, among 24 communities with enough sales.
Have off-plan property prices dropped in Dubai in 2026?
Within the same projects, barely: the median project's price per sq ft changed by −0.9% between January–February and July–October 2026, across 387 projects. The median off-plan price fell 25% because more of the units sold were studios.
Is the Dubai property market crashing?
Dubai Land Department records show apartment and villa sales numbers down by a third between January and October 2026, and ready apartment prices 6.7% lower at the median, with no further fall after July. Off-plan prices within the same projects were about level.
Where can I see registered sale prices for a building in Dubai?
Dubai Land Department's open-data Real Estate Data page lists registered transactions by date, area and property type, with a CSV download; the building's name is in the project column.
Источники
- Dubai Land Department: Real Estate Data (open data, transactions) (every 2026 price and count on this page; export of 4 November 2026; checked 16 November 2026)
- Sharjah 24 (WAM): UAE air defences successfully intercept Iranian missiles, drones, 28 February 2026 (the date the periods are split on; checked 16 November 2026)
- The National: Dubai home sale transactions fall in third quarter amid regional uncertainty, 7 October 2026 (S&P Global Ratings' 5% to 15% range; Cavendish Maxwell on registration lag; checked 16 November 2026)
Registered prices differ building by building. If you are buying or selling, ask us for the registered prices in the building you're looking at, or browse our properties for sale.